Dengue Prediction
Novel Insights into Dengue Fever Transmission Dynamics using a Machine Learning Prediction Model
Introduction
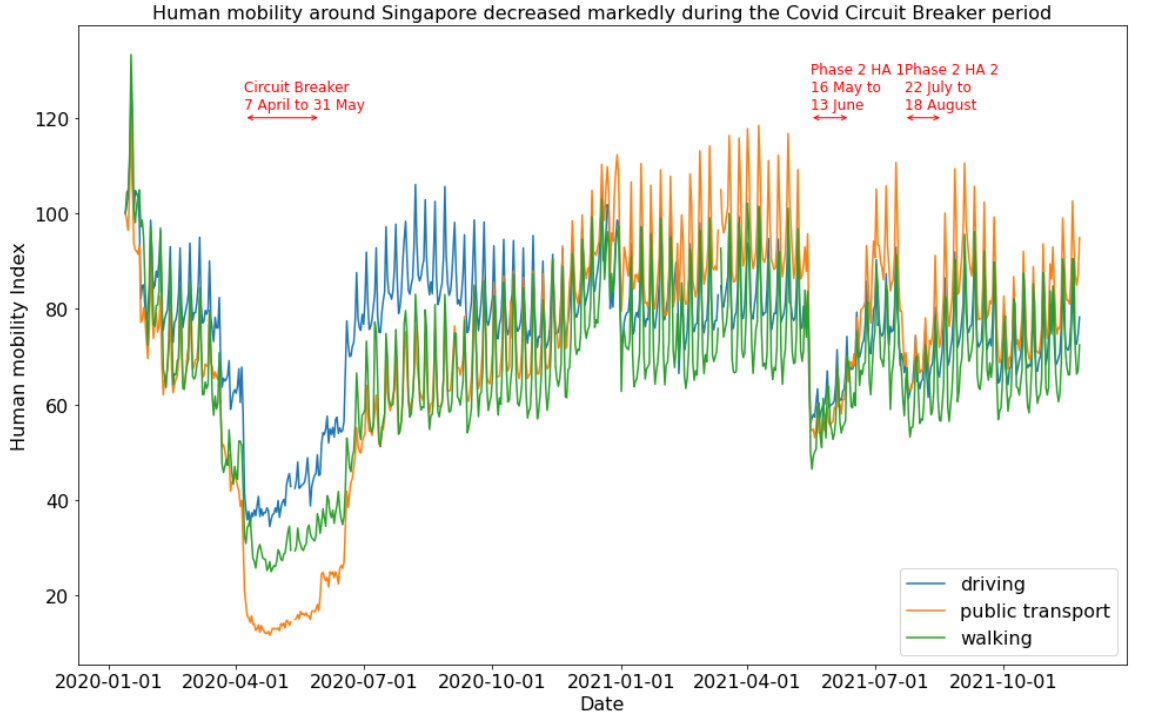
Singapore experienced its worst ever dengue fever outbreak in 2020, soon after its Circuit Breaker (full lockdown) period.
Objective
This study investigated the relationship between human mobility during lockdowns and the number of dengue fever cases; and developed a machine learning prediction model for dengue fever.
Material and Methods
Dengue fever data from the Ministry of Health (Singapore), climate data from Visual Crossing and human mobility data from Apple were acquired and analysed. The relationship between temperature, rainfall, humidity, human mobility, and dengue fever cases was studied. Machine learning was used to develop and validate a Ridge regression model with leave-out-one-cross-validation and hyperparameter tuning.
Results
There was a very strong correlation between human mobility and the number of dengue fever cases 10 weeks later (r = -0.95, p < 0.001). A decrease in human mobility during a full lockdown resulted in a marked increase in dengue fever 10 weeks later. The prediction equation was: Weekly dengue fever cases = 52.01 * maximum temperature - 16.80 * human mobility via public transport 10 weeks earlier + 15. More than 90% of the variation in dengue fever incidence can be predicted by a change in human mobility 10 weeks earlier.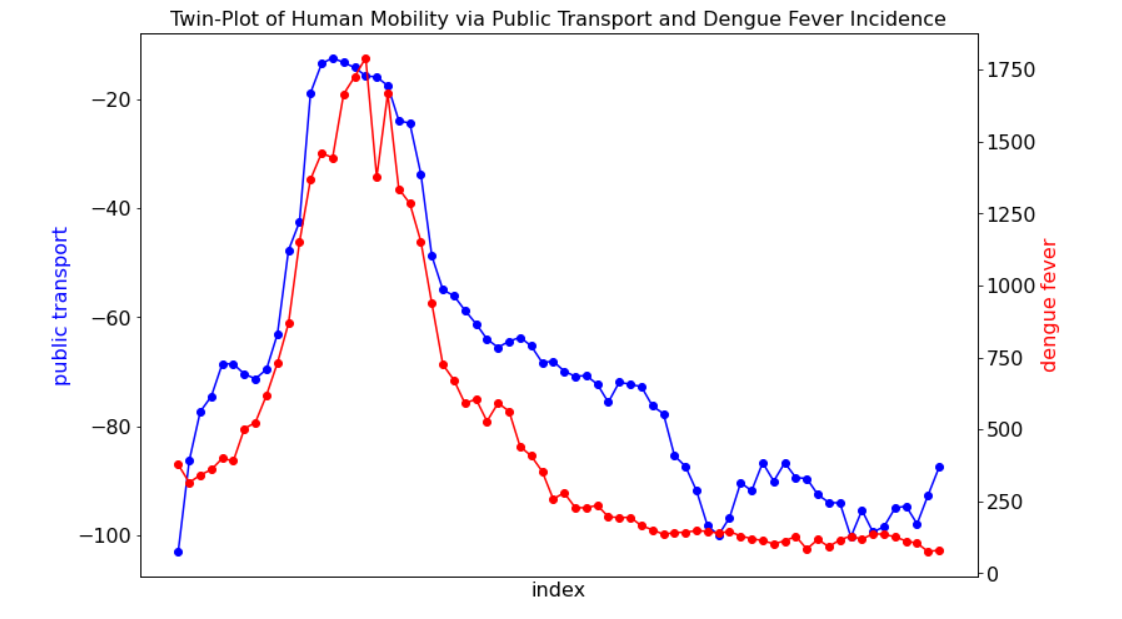
Conclusion
Human mobility data is not only useful for Covid transmission dynamics, but also for epidemic modelling for other diseases like dengue fever. There was a very strong negative correlation between human mobility and the number of dengue fever cases 10 weeks later. Lockdowns are effective in controlling Covid but exacerbate the spread of dengue fever in Singapore.